Fundamental
Overview
The Russell 2000 has been
outperforming the other major indices recently as there’s much more value compared
to the S&P 500 or the Nasdaq. The market is now looking forward to the next
year with Trump’s policies being a positive driver for growth.
The only bearish reason we
had for the stock market was the rise in Treasury yields. That’s generally
bearish only when the Fed is tightening policy though not when yields rise on
positive growth expectations.
Right now, the Fed’s
reaction function is that a strong economy would warrant an earlier pause in
the easing cycle and not a tightening. That should still be supportive for the
stock market in the bigger picture.
If the Fed’s reaction
function were to change to a potential tightening, then that will likely trigger
a big correction in the stock market on expected economic slowdown. For now,
the pullbacks look as something healthy and opportunities to buy the dips.
Russell 2000
Technical Analysis – Daily Timeframe
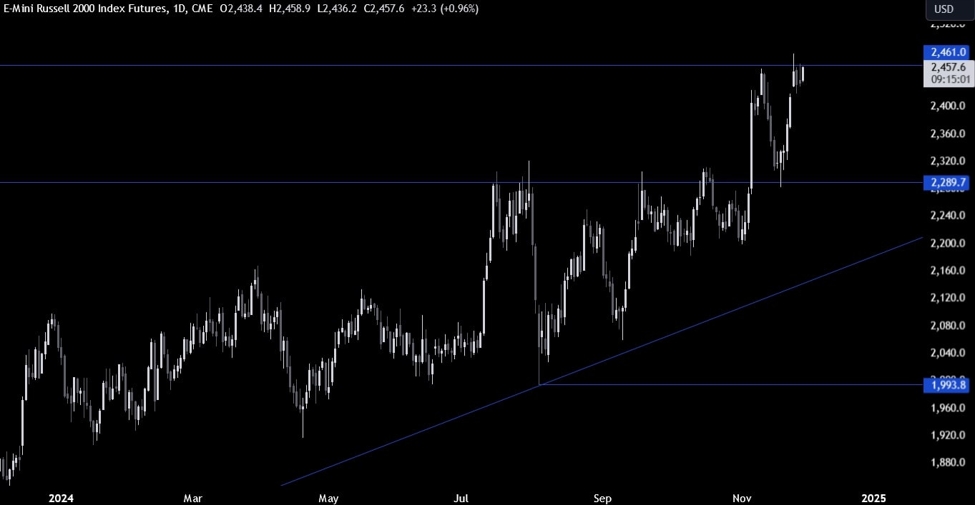
Russell 2000 Daily
On the daily chart, we can
see that the Russell 2000 is consolidating around the all-time highs. The
buyers will want to see the price breaking higher to increase the bullish bets
into new highs. The sellers, on the other hand, will keep on piling in around
these levels to position for a drop back into the 2290 support.
Russell 2000 Technical
Analysis – 4 hour Timeframe
Russell 2000 4 hour
On the 4 hour chart, we can
see that we have a rangebound price action between the 2418 support and the
2461 resistance. The market participants will likely keep on playing the range
until we get a breakout on either side.
Russell 2000 Technical
Analysis – 1 hour Timeframe
Russell 2000 1 hour
On the 1 hour chart, we can
see that we have an upward trendline
defining the bullish momentum on this timeframe. The buyers will likely lean on
it to position for a break into new highs, while the sellers will look for a
break lower to target a pullback into the 2418 support. The red lines define
the average daily range for today.
